N2O as a tracer for atmospheric transport
We chose nitrous oxide (N2O) to assess the BDC changes because it increases linearly in the troposphere and is transported into the stratosphere where its lifetime is approximately 120 years. This makes N2O an excellent tracer for atmospheric transport studies: any deviation from its linear increase can be attributed to changes in transport.
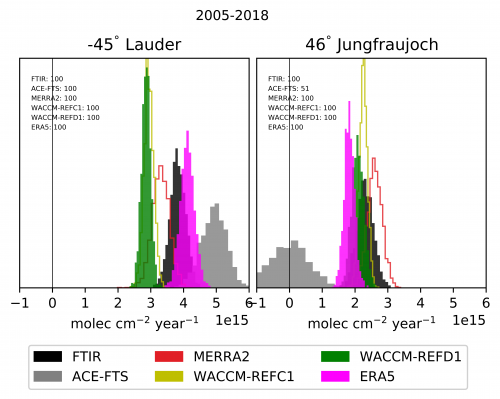
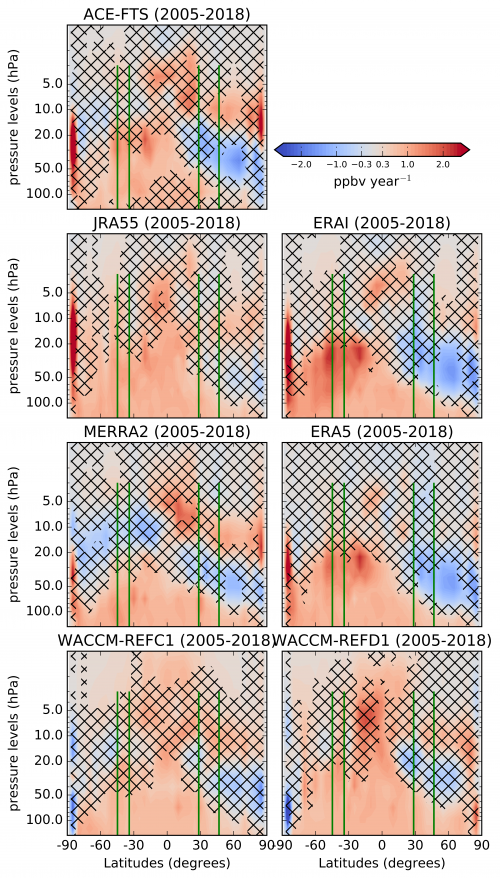
We study decadal (2005-2018) N2O trends measured by ground-based Fourier Transform Infrared (FTIR) spectrometers and by the space-borne Atmospheric Chemistry Experiment Fourier-Transform Spectrometer (ACE-FTS). We compare these measurements with simulations of the Belgian Assimilation System for Chemical ObsErvations (BASCOE) model driven by four dynamical reanalyses, and with simulations of the Whole Atmosphere Community-Climate Model (WACCM).
N2O trends at the ground-based stations
The ground-based FTIR stations are located at Lauder, New Zealand (45°S) and Jungfraujoch, Switzerland (46°N). We average the N2O trends between 12 and 40 km of altitude because of the low resolution of the instruments.
For the FTIR and ACE-FTS measurements, the N2O trends are larger at Lauder compared to Jungfraujoch (i.e., hemispheric asymmetry in the N2O trends). The BASCOE model driven by the reanalyses from the European Center for Medium Range Weather Forecast (ECMWF) successfully reproduces this asymmetry but the WACCM simulations do not show significant differences.
Global N2O trends
Globally-resolved ACE-FTS measurements confirm the hemispheric asymmetry in the N2O trends: positive trends over the Southern Hemisphere (SH) and negative over the Northern Hemisphere (NH) in the mid-low stratosphere. The BASCOE simulations consistently reproduce this pattern, especially with the ECMWF reanalyses. Sensitivity tests with the BASCOE model confirm the prominent role of the changes in transport in causing such asymmetry. The WACCM simulations show a weaker asymmetry, but the new WACCM version performs better than the previous version over the SH.
The present study reveals that:
- N2O is a useful tracer for studying changes in the BDC.
- The low resolution of the N2O FTIR measurements limits the N2O trend analysis in the stratosphere.
- Satellite measurements and the BASCOE simulations depict a hemispheric asymmetry in the N2O trends, which can be attributed to changes in transport.
- The improvements between the WACCM versions highlight that next-generation model simulations can potentially reach the quality of the reanalyses.
Reference:
Minganti D., Chabrillat S., Errera Q., Prignon M., Kinnison D. E., Garcia, R. R., et al. (2022). Evaluation of the N2O rate of change to understand the stratospheric Brewer-Dobson circulation in a Chemistry-Climate Model. Journal of Geophysical Research: Atmospheres, 127, e2021JD036390, https://doi.org/10.1029/2021JD036390


