Body text
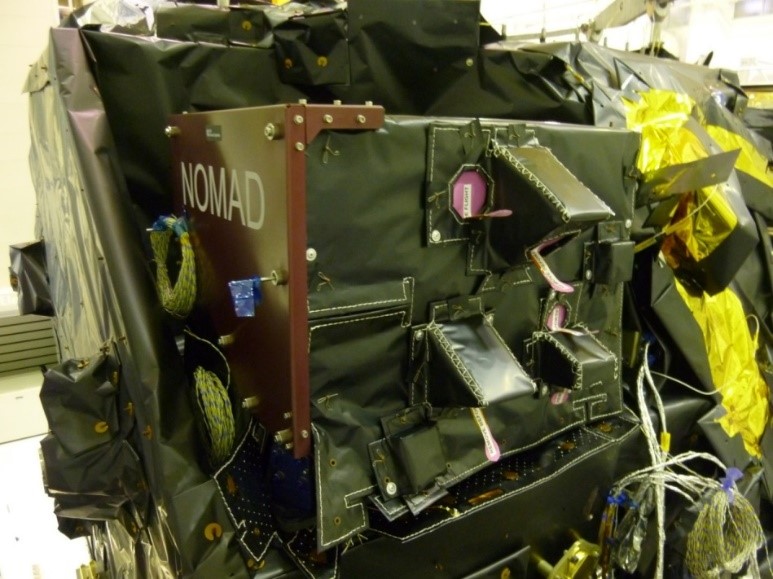
NOMAD is a suite of three spectrometers, measuring in the ultraviolet, visible and infrared regions of the spectrum. In these spectral regions, many molecules either absorb or emit radiation. These distinctive patterns allow us to determine which gases are present and in what concentrations.
The presence (or not) of absorption bands can tell us a lot about the atmosphere of Mars:
- The shape of the measured carbon dioxide (CO2) absorptions gives us the temperature and the density of the observed atmosphere, allowing us to model the atmosphere.
- Different isotopes of the same molecules absorb sunlight differently, allowing us to measure the isotope ratios of gases and to determine, for example, how much water has been lost from the surface of Mars over time.
- Clouds and surface ice also have distinctive spectral patterns - reflecting or scattering sunlight - as do dust and aerosol particles, which block different wavelengths of sunlight depending on the size of the particles in the air. Therefore, by measuring in different wavelengths, we can detect and measure dust and ice, either in clouds or on the planet’s surface.
- By measuring the limb of Mars, we can measure the strength of red and green light emitted by the atmosphere, which is an indicator of the temperature and density of the atmosphere at high altitudes.
By making tens of millions of measurements across many years, locations, altitudes and times of day, we can map seasonal and geographical trends, which allow us to understand more about the processes that are occurring in the atmosphere of Mars. Then, by correlating the observed concentrations of different molecules with each other, with clouds, and with dust particle sizes, we can understand the atmospheric cycles and chemistry better than ever before.
This in turn leads to improvements in our simulations and circulation models of Mars, as the discoveries increase our understanding of the ongoing atmospheric processes.
A full list of publications is available on the NOMAD website