This is an article from NASA
By combining observations from three international spacecraft at Mars (including BIRA-IASB's NOMAD instrument), scientists were able to show that regional dust storms play a huge role in drying out the Red Planet.
Dust storms heat up higher altitudes of the cold Martian atmosphere, preventing water vapor from freezing as usual and allowing it to reach farther up. In the higher reaches of Mars, where the atmosphere is sparse, water molecules are left vulnerable to ultraviolet radiation, which breaks them up into their lighter components of hydrogen and oxygen. Hydrogen, which is the lightest element, is easily lost to space, with oxygen either escaping or settling back to the surface.
“All you have to do to lose water permanently is to lose one hydrogen atom because then the hydrogen and oxygen can’t recombine into water,” said Michael S. Chaffin, a researcher at the Laboratory for Atmospheric and Space Physics at the University of Colorado at Boulder. “So when you’ve lost a hydrogen atom, you’ve definitely lost a water molecule.”
Scientists have long suspected that Mars, once warm and wet like Earth, has lost most of its water largely through this process, but they didn’t realize the significant impact of regional dust storms, which happen nearly every summer in the planet’s southern hemisphere. Globe-enveloping dust storms that strike typically every three to four Martian years were thought to be the main culprits, along with the hot summer months in the southern hemisphere when Mars is closer to the Sun.
But the Martian atmosphere also gets heated during smaller, regional dust storms, according to a new paper published August 16 in the journal Nature Astronomy. The researchers, an international team led by Chaffin, found that Mars loses double the amount of water during a regional storm as it does during a southern summer season without regional storms.
“This paper helps us virtually go back in time and say, ‘OK, now we have another way to lose water that will help us relate this little water we have on Mars today with the humongous amount of water we had in the past,” said Geronimo Villanueva, a Martian water expert at NASA’s Goddard Space Flight Center in Greenbelt, Maryland, and co-author on Chaffin’s paper.

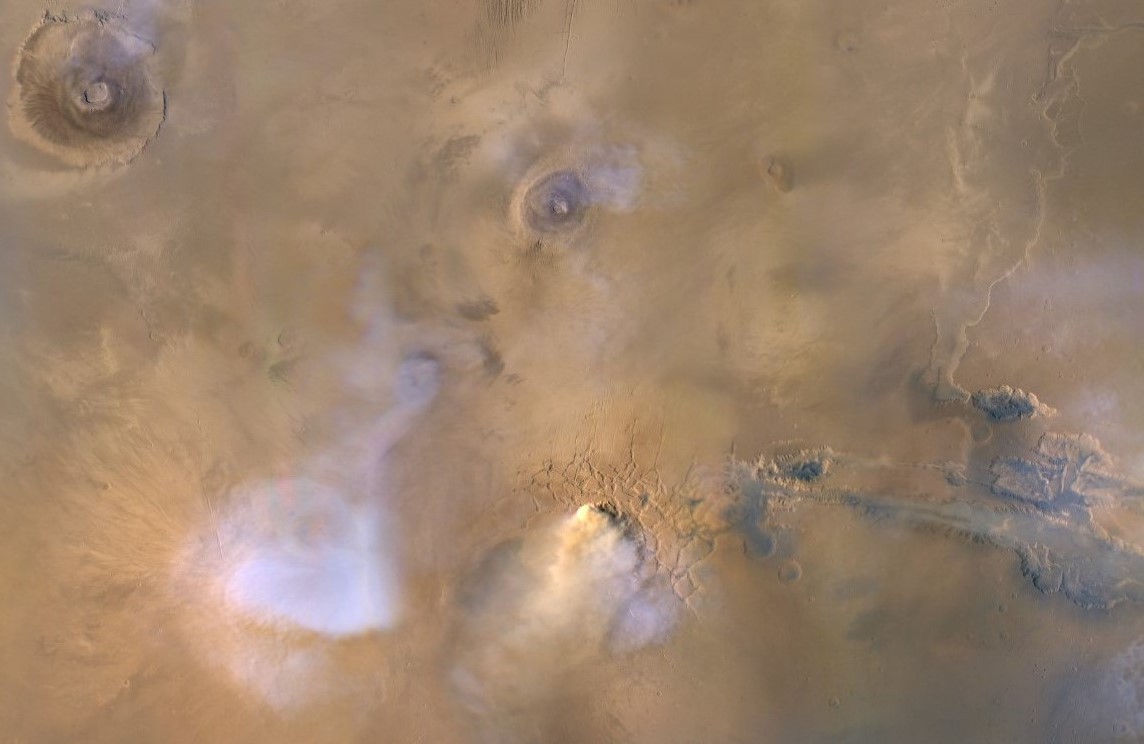
Credits: NASA/JPL-Caltech/MSSS
Since water is one of the key ingredients for life as we know it, scientists are trying to understand how long it flowed on Mars and how it was lost.
Billions of years ago, Mars had vastly more water than it does today. What’s left is frozen at the poles or locked in the crust. Melted, this leftover water could fill a global ocean up to 100 feet, or 30 meters, deep, some scientists predict.
Although scientists like Chaffin had many ideas about what was happening to the water on Mars, they lacked the measurements needed to tie the whole picture together. Then, a rare convergence of spacecraft orbits during a regional dust storm in January through February 2019 allowed scientists to collect unprecedented observations.
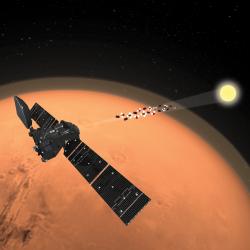
NASA's Mars Reconnaissance Orbiter measured the temperature, dust and water-ice concentrations from the surface to about 62 miles, or 100 kilometers, above it. Looking within the same altitude range, ESA's (European Space Agency) Trace Gas Orbiter measured the concentration of water vapor and ice. And NASA’s Mars Atmosphere and Volatile EvolutioN, or MAVEN, spacecraft capped off the measurements by reporting the amount of hydrogen, which would have broken off H2O molecules, in the highest reaches of Mars, upwards of 620 miles, or 1,000 kilometers, above the surface.
It was the first time so many missions focused in on a single event, Chaffin said: “We’ve really caught the whole system in action.”
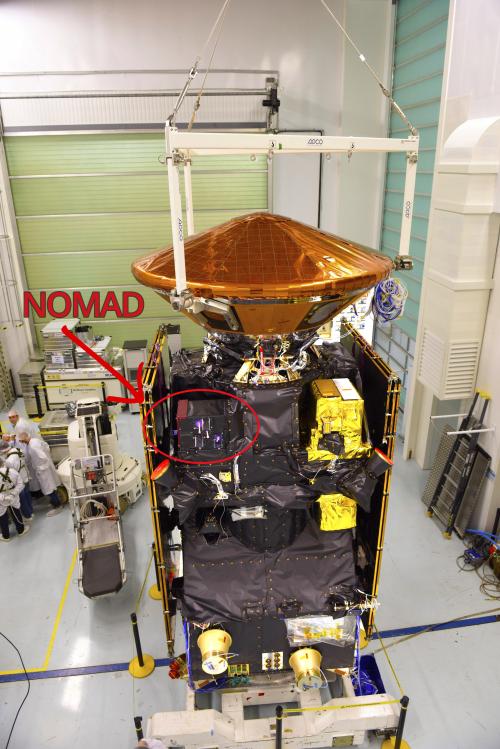
The data collected from four instruments on the three spacecraft paint a clear picture of a regional dust storm’s role in Martian water escape, scientists report. “The instruments should all tell the same story, and they do,” said Villanueva, a co-investigator of the NOMAD instrument aboard the Trace Gas Orbiter.
NOMAD and ACS, another instrument on the European orbiter, showed water vapor in the lower atmosphere before the dust storm began. As the dust storm took off, heating the atmosphere and generating winds, the instruments saw water vapor catapulted to higher altitudes. TGO found 10 times more water in the middle atmosphere after the dust storm started, which coincides precisely with data from the infrared radiometer on the Mars Reconnaissance Orbiter.
The radiometer measured rising temperatures in the atmosphere as dust accumulated above Mars. It also saw water-ice clouds disappear, as expected since ice could no longer condense near the warmer surface. Images from MAVEN’s ultraviolet spectrograph confirm this; they show that before the 2019 storm ice clouds could be seen hovering above the soaring volcanoes in the Tharsis region of Mars. “But they disappeared completely when the dust storm was in full swing,” Chaffin said, and reappeared after the dust storm ended.
When it is raised to higher altitudes water vapor is expected to break down into hydrogen and oxygen by the Sun’s ultraviolet radiation. Indeed, observations from MAVEN showed this, as the orbiter captured the upper atmosphere airglow with hydrogen that increased by 50% during the storm. This measurement corresponded perfectly with a swelling of water 60 miles below, which scientists say was the source of the hydrogen.
This research was funded in part by the MAVEN mission. MAVEN's principal investigator is based at the University of Colorado Boulder's Laboratory for Atmospheric and Space Physics, and NASA Goddard manages the MAVEN project.
By Lonnie Shekhtman
NASA's Goddard Space Flight Center, Greenbelt, Md.
Original article on the NASA website
Credits: NASA/JPL-Caltech/MSSS
Credits: Michael S. Chaffin


