


Calibration of Martian data from NOMAD published in Planetary and Space Science
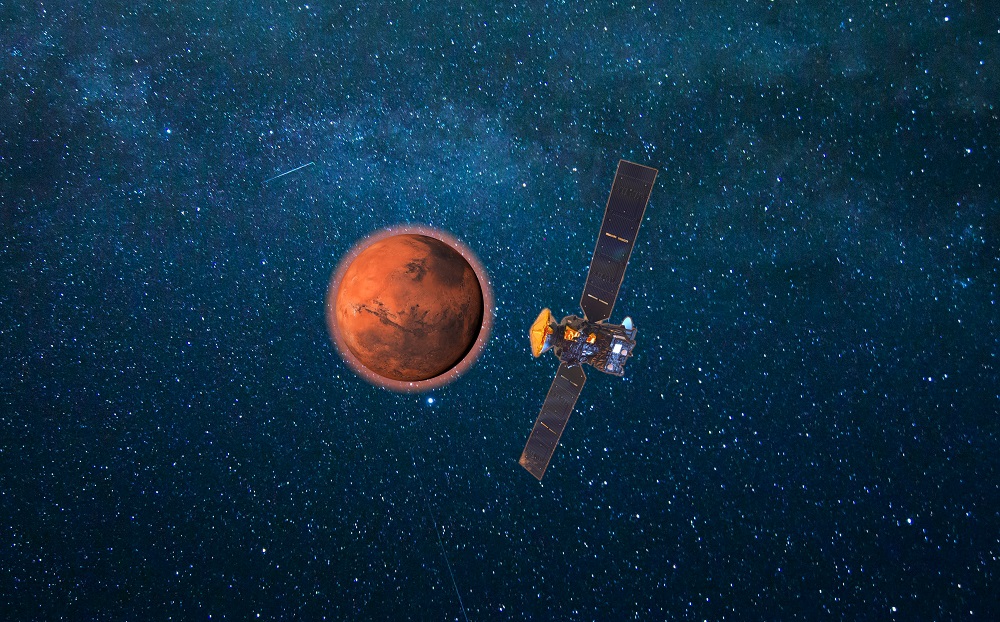
Gathering information on planets of the solar system from space missions isn’t as simple as an internet download. Scientific instruments onboard the various exploring spacecraft send back data in a long string of ones and zeros in raw format - cluttered with all kinds of biases and noise - which is pretty much useless if left unprocessed. The crucial step of data processing is the responsibility of the Principal Investigators (PI) of the instruments. The PI for the NOMAD instrument onboard ESA’s ExoMars Trace Gas Orbiter - currently orbiting and observing the planet Mars – is the group Planetary Atmospheres of BIRA-IASB. Consequently, it is up to our researchers and engineers of this group to handle, among other things, the calibration (to check how accurately the instrument is working) and the set-up and maintenance of the data pipeline (the software that converts all the incoming raw data into information that the scientists can analyse).
Calibrating the NOMAD instrument
NOMAD contains 3 spectrometers: one is called UVIS (for UV and visible light) and can observe the same colours that our eyes see and more. The other two, SO and LNO, measure infrared light, coming either directly from the Sun or from sunlight reflected off the surface and clouds of Mars. All three NOMAD channels were calibrated in controlled conditions in a lab before the mission was launched, but we still need to run special calibration observations during the mission as well, because we use that information to calibrate all the scientific observations, so that scientific conclusions based on the data reflect reality as closely as possible.
The UVIS spectrometer
The UVIS spectrometer measures wavelengths between 200-650 nanometres (one millionth of a millimetre), spread over 1024 different pixels on a detector (figure 3). This means that we can measure colours very accurately to determine the concentrations of ozone, clouds and aerosols (very small particles) in the atmosphere of Mars. The data pipeline corrects the detector signal, removing an offset (a small signal that comes from the electronics of NOMAD) and the dark current (the signal due to heat in the detector), removing unwanted noise and other effects.
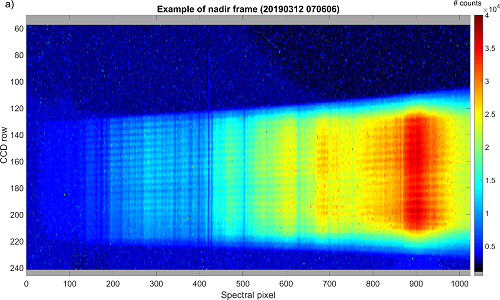
UVIS is like a camera, made up of 1024 spectral pixel covering the ultraviolet from 200
nm (first column on the left) to the visible around 650 nm (last column on the right).
The colour scale gives the recorded intensity in counts, which needs to be converted to
real units (like radiance or transmittance) for the scientists to analyse. About 80-100
detector rows are illuminated and can be summed together to increase the
signal-to-noise ratio of the measurements, making the spectra more accurate.
Credit: BIRA-IASB
A spectral calibration is also applied, which assigns a wavelength to each of the 1024 pixels on the detector, as is a stray light correction, which corrects for light hitting the wrong pixels on the detector. This latter part is particularly important, as it corrects the spectra recorded by UVIS so that scientists can correctly interpret them – and so a study was performed where two different and independent methods were devised. Both methods gave the same results, which gave us additional confidence that the method was correct.
Finally, once all corrections and calibrations have been applied, the scientific observations are converted into radiance or transmittance units that are understood by scientists.
To check that the data pipeline is working correctly, NOMAD observations are continuously compared to measurements from the MARCI instrument onboard the MRO spacecraft, which is also in orbit around Mars and periodically measures the same region of the planet at around the same time. Both instruments agree to within 10%, which again, makes us confident that everything is correct.
The infrared spectrometers
The two infrared spectrometers measure wavelengths between 2.2 and 4.3 micrometres (one thousandth of a millimetre). Like for UVIS, many calibration measurements were made prior to launch, on the voyage to Mars, and continue to be made in-flight during the science phase of the mission.
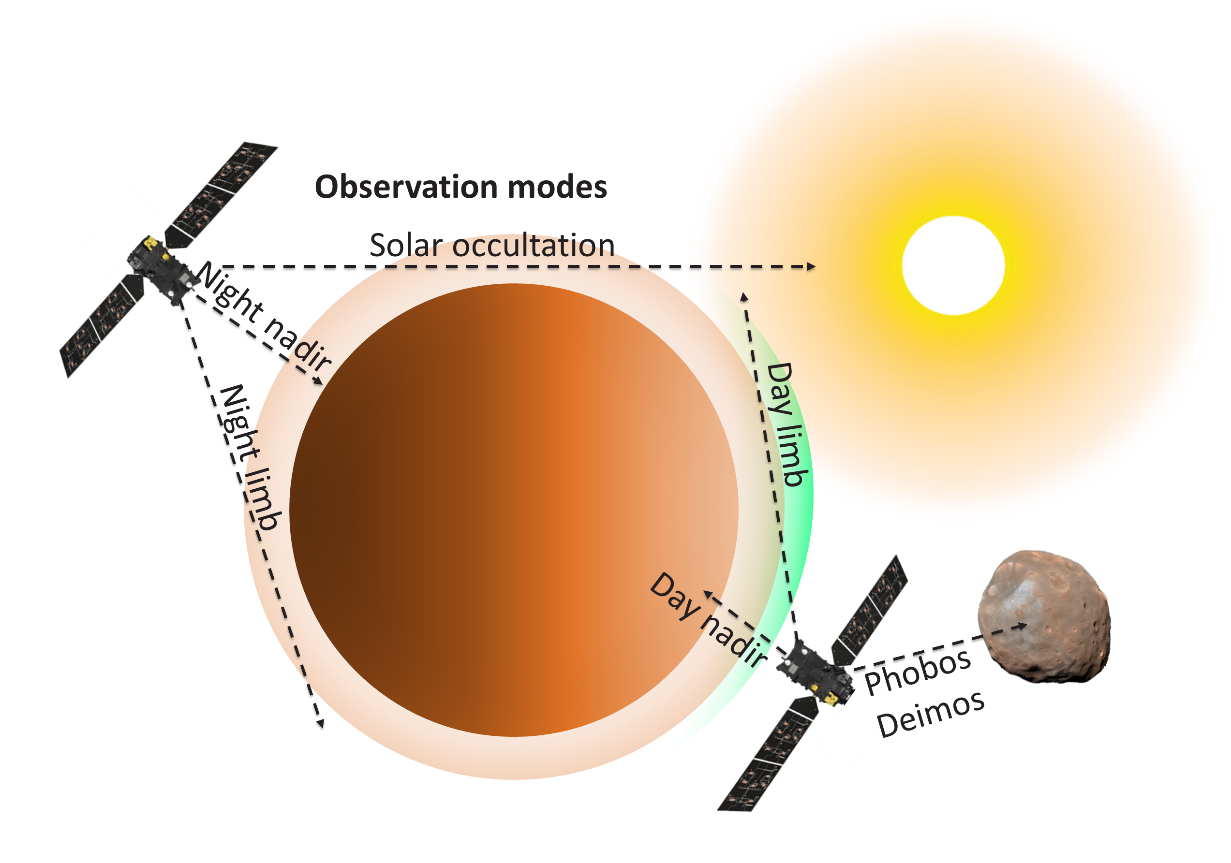
The SO spectrometer measures the Martian atmosphere using a technique known as a “solar occultation”. To do this, SO points at the Sun and then measures the absorption of the atmosphere between the instrument and the Sun at sunrise and sunset. In this way, the gases which make up the atmosphere, and the aerosols and clouds which block the light, can be measured very accurately.
Like UVIS, the LNO spectrometer can operate in many different modes: limb (where it observes the edge of the planet’s atmosphere), nadir (where it points straight down to the planet) and occultation, the same as SO. These are shown in figure 4. The LNO spectrometer is specially adapted to measure in nadir, and so this was a main objective of the recent work to calibrate NOMAD.
Both the SO and LNO spectrometers were calibrated, including measuring the performance of the detector and optical components, to enable us to convert the incoming data into useable scientific measurements. Two teams, using different approaches, investigated the calibration of the LNO channel independently: they agree with each other to within 3%, giving us additional confidence that the calibration is correct.
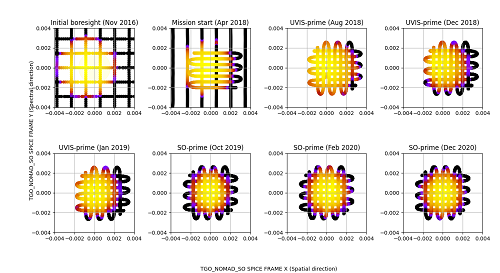
spectrometer. The spacecraft moves so that the spectrometers observe the sun in two
directions, which creates the horizontal and vertical tracks across the solar disk.
Yellow indicates that the signal is high (where we see the sun) and black is zero
(where we see dark space). The Sun is centred on (0, 0), which means that it is
exactly where we expect, meaning that our pointing direction is correct.
Credit: BIRA-IASB
As all the spectrometers point towards the Sun, which is only around 1/3 of a degree in diameter as seen from Mars (narrower than the width of your little finger at arm's length), the pointing direction of the channels had to be very accurately measured and is regularly checked to make sure that it is not shifting over time. To do this, the spacecraft performs a manoeuvre so that all the spectrometers see the Sun (which gives a high signal on the detector) and the dark space around the Sun (which gives no signal). Then we can compare the pointing direction of the spacecraft to the measurements, and see if the Sun is observed exactly when and where we expect it to be: if not, this means that our pointing direction is slightly wrong, and so we use these observations to find the best pointing vector. Three examples are shown in figure 5.
NOMAD data up until today are calibrated
New data is continuously arriving from Mars: once the measurements have been calibrated, the outputs are shared with the worldwide scientific community to be analysed and then compared against previous measurements and modelling efforts (for example, GEM Mars. This allows us to retrieve valuable information about the physical and chemical processes taking place in the Martian atmosphere.
Publications
A list of publications is available on our website: nomad.aeronomie.be
References
- Calibration of the NOMAD-UVIS data by Willame et al., https://orfeo.belnet.be/handle/internal/9995
- Calibration of NOMAD on ESA's ExoMars Trace Gas Orbiter: Part 1 – The Solar Occultation channel by Thomas et al., https://doi.org/10.1016/j.pss.2021.105411
- Calibration of NOMAD on ESA's ExoMars Trace Gas Orbiter: Part 2 – The Limb, Nadir and Occultation (LNO) channel by Thomas et al., https://orfeo.belnet.be/handle/internal/9994
- Calibration of NOMAD on ExoMars Trace Gas Orbiter: Part 3 - LNO validation and instrument stability by Cruz-Mermy et al., https://doi.org/10.1016/j.pss.2021.105399
- Removal of straylight from ExoMars NOMAD-UVIS observations by Mason et al., https://orfeo.belnet.be/handle/internal/9990
News image 1
News image legend 1
Credit: BIRA-IASB
News image 2
News image legend 2
Credit: BIRA-IASB